Climate scenario analysis
docs-reg's own verdict on this one: no new calculator, just 10.5's exact scenario-replay harness fed NGFS-style transition pathways and a 25-year horizon instead of quarters. The loss table grows with horizon here, the opposite of 10.5's finding — and testing why teaches a real lesson about what a stress test's own baseline is allowed to do.
10.5 asked what a book loses over the next three quarters if the economy turns severely adverse. Climate scenario analysis asks almost the same question over 25 years instead of nine months — three transition pathways instead of two stress scenarios, decades of checkpoints instead of quarters. It needs no new calculator to answer it.
The whole story
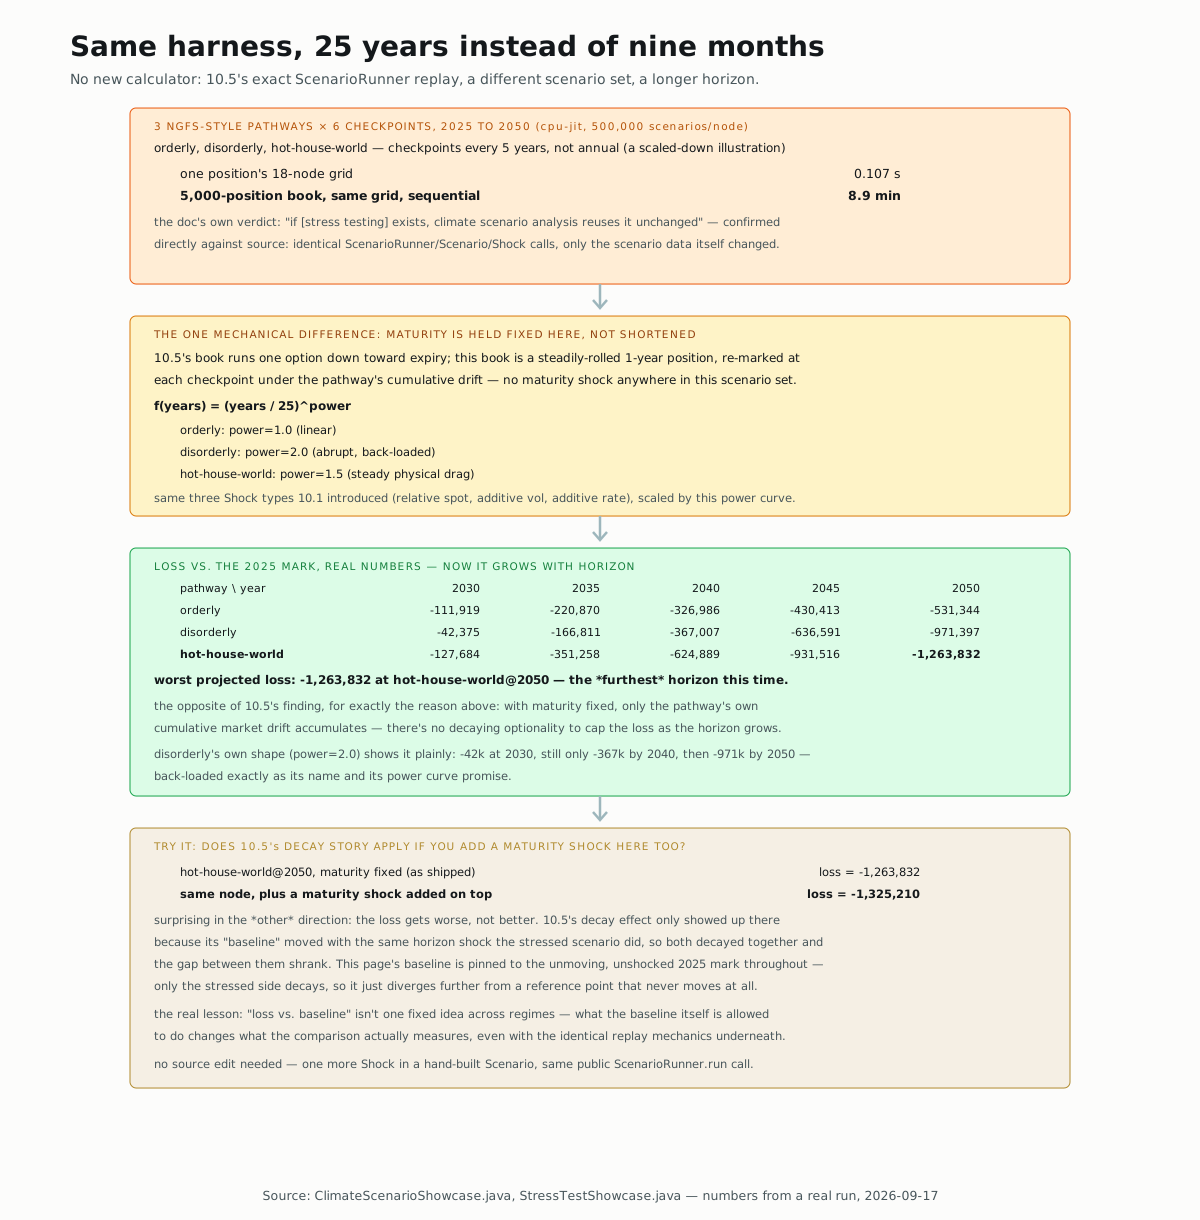
ClimateScenarioShowcase's own doc comment states the one mechanical
change plainly: "unlike the stress-test page, remaining maturity is held
fixed at one year at every checkpoint: this book is a steadily-rolled
short-dated position being re-marked under each pathway's cumulative
drift, not one trade running down to expiry over 25 years." Everything
else — the ScenarioRunner.run calls, the call/put book, the seed — is
identical to 10.5's. docs-reg/climate-scenario-analysis.md calls for
exactly this: "if [stress testing] exists, climate scenario analysis
reuses it unchanged, with the NGFS macro variables as scenario inputs" —
confirmed directly against source, no new calculator anywhere.
Build the pathway grid
Three pathways, each a target spot/vol/rate shock reached via its own power curve, crossed with six checkpoints:
private record Pathway(String name, double spotTarget, double volTarget, double rateTarget, double power) {
  Scenario at(int years) {
    double f = Math.pow((double) years / HORIZON_YEARS, power);
    return Scenario.of(name + "@" + (2025 + years),
        Shock.relative("spot", spotTarget * f),
        Shock.additive("vol", volTarget * f),
        Shock.additive("rate", rateTarget * f));
  }
}

List<Pathway> pathways = List.of(
    new Pathway("orderly", -0.15, 0.03, 0.010, 1.0),
    new Pathway("disorderly", -0.30, 0.15, 0.020, 2.0),
    new Pathway("hot-house-world", -0.35, 0.10, -0.015, 1.5));
power shapes the pathway's story: orderly ramps linearly (power=1.0,
smooth and early, as NGFS's own name for it implies); disorderly is
quadratic (power=2.0, barely moving at first, then abrupt); hot-house-world
sits between the two (power=1.5, a steady, continuous physical drag).
No maturity shock anywhere in this list — the same three Shock types
10.1 introduced, just riding a different curve.
Revalue across 18 nodes
Real numbers, 500,000 scenarios per node, cpu-jit, seed 42, loss
against the fixed, unshocked 2025 mark:
| pathway \ year | 2030 | 2035 | 2040 | 2045 | 2050 |
|---|---|---|---|---|---|
| orderly | -111,919 | -220,870 | -326,986 | -430,413 | -531,344 |
| disorderly | -42,375 | -166,811 | -367,007 | -636,591 | -971,397 |
| hot-house-world | -127,684 | -351,258 | -624,889 | -931,516 | -1,263,832 |
disorderly's own numbers make its power=2.0 curve visible without
needing the formula: barely -42k by 2030, only -367k by 2040, then
nearly -1m by 2050 — back-loaded exactly as the name and the exponent
both promise.
The worst projected loss here is -1,263,832, at hot-house-world@2050
— the furthest horizon, the opposite of 10.5's nearest-horizon-worst
finding. Same replay mechanics, opposite shape, for the reason the first
sidenote named: with maturity held fixed, there's no shrinking optionality
to cap the loss as the horizon grows — only the pathway's own cumulative
market drift, which never stops accumulating. 10.5's counterintuitive
result and this page's intuitive one are both correct; they're answering
different questions with the same tool.
Try it yourself
If 10.5's shrinking-maturity story explains why that page's losses
shrink with horizon, does adding a maturity shock here make this page's
losses shrink too? Built the hot-house-world@2050 node by hand, once as
shipped (maturity fixed) and once with an extra Shock.additive("maturity", -0.99) layered on top, both compared against the same 2025 baseline.
Real numbers: fixed-maturity loss -1,263,832; with the maturity shock
added, -1,325,210 — worse, not better.
The reason is worth sitting with: 10.5's decay effect only appeared
because its "loss" compared each stressed scenario against a
horizon-matched baseline that carried the identical maturity shock —
both sides decayed together, so the gap between them narrowed. This
page's baseline is pinned to the unmoving 2025 mark throughout, so adding
decay to only the stressed side just pushes it further from a reference
point that never moves. Same mechanics, same ScenarioRunner.run call —
but "loss vs. baseline" measures something different depending on what
the baseline itself is allowed to do.
▶️ Run it
10.5's exact harness, unchanged, live — right here (the interactive example), fed the NGFS pathway grid instead of the macro/horizon one:
Or run the real thing:
mvn -o -q install
mvn -o -q -pl nablatensor-examples exec:java \
  -Dexec.mainClass=com.nablatensor.examples.ClimateScenarioShowcase
Defaults to cpu-jit, 500,000 scenarios per node, no GPU.
⚠️ What this doesn't do
The pathway curves are explicitly illustrative — the source's own doc
comment says so directly — chosen to show the qualitative NGFS shape
(orderly smooth and early, disorderly abrupt and back-loaded,
hot-house-world a continuous physical drag), not the published NGFS
macro-variable paths. The real regulatory grid steps annually, not every
five years; this is an 18-node illustration of a grid a real exercise
runs at roughly five times the resolution. And per docs-reg/climate- scenario-analysis.md's own "partial fit" verdict — softening as a US
driver, EU/UK-only, still-maturing methodology — climate-economic
scenario construction, sector transition modelling, physical-hazard
mapping, and counterparty-level emissions data all sit outside a pricing
engine entirely, same list the showcase's own final printout gives.
What's next
→ Deeper: docs-reg/climate-scenario-analysis.md
covers the real programme detail (ECB Fit-for-55, Bank of England NGFS
work, the Fed's 2025 step back) this page's code doesn't touch.
→ Chapter 10 (Regulatory capital) is complete. Next: CVA from first
principles, a deeper look at the
exposure simulation 10.3 already used for SA-CVA's sensitivity vector.