Backtesting a VaR model: did the forecast hold up?
A 99% one-day VaR number is a promise: losses should beat it on 99 days out of 100. VarBacktest turns 2,000 days of realised P&L into two independent chi-square tests of that promise — one for the exception rate, one for whether the exceptions clustered when it mattered most.
Module 9.1 built three VaR numbers on the same book and they didn't agree.
None of that matters if nobody ever checks whether the number the desk
actually reported was right. A 99% one-day VaR of 67,294 is a falsifiable
claim — losses should exceed it on roughly 1 day in 100 — and VarBacktest
is the class that goes and checks, using nothing but the realised P&L and
the forecast that was made for each of those days.
The whole story
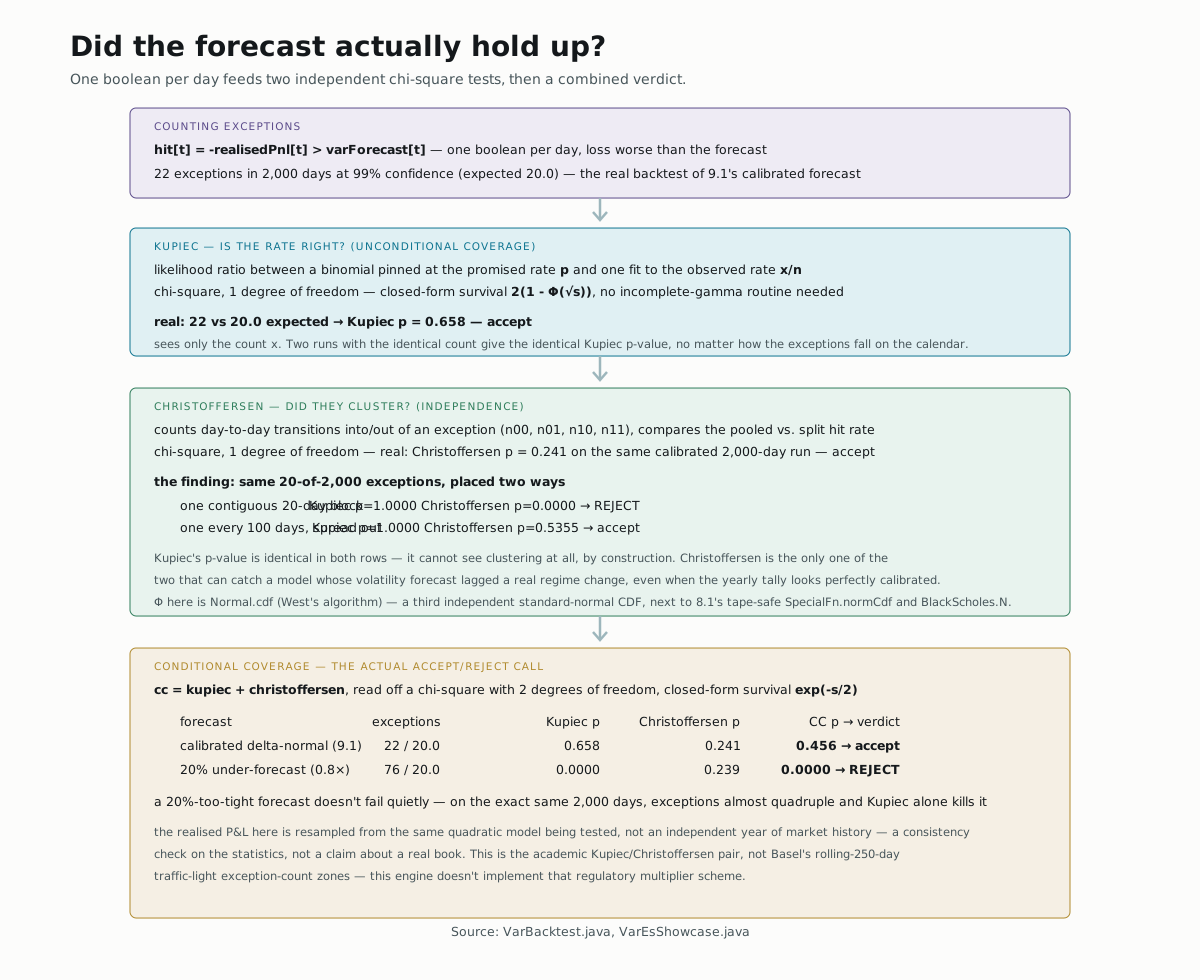
Both chi-square reference distributions here have closed-form survival
functions — 2(1 - Φ(√s)) for one degree of freedom, exp(-s/2) for two —
so VarBacktest never needs an incomplete-gamma routine, per its own class
doc. Φ itself is Normal.cdf, West's rational approximation (absolute
error under 1e-15) — a third independently-implemented standard-normal
CDF in this codebase, next to 8.1's tape-safe logistic SpecialFn.normCdf
and the erfc-based BlackScholes.N that's priced every European call since
1.3. This module needs the precise one because there's no tape here at
all — it's ordinary host-side statistics on a P&L series, not a
differentiable pricer.
Counting exceptions
Everything starts from one boolean per day: did the realised loss beat the forecast?
boolean[] hit = new boolean[n];
int x = 0;
for (int t = 0; t < n; t++) {
  hit[t] = -realisedPnl[t] > varForecast[t];
  if (hit[t]) {
    x++;
  }
}
realisedPnl is signed (positive is profit); varForecast is a positive
loss number, so the sign flip on the left makes the comparison read
naturally as "loss exceeded the forecast." Everything below is built from
this one array of booleans and its count x — the picture's whole left
column.
Kupiec: is the rate right?
Kupiec's proportion-of-failures test asks a single question: over n days,
is the observed exception rate x/n statistically consistent with the
rate p = 1 - alpha the forecast promised? It's a likelihood-ratio test
between two binomial models — one pinned at the promised rate, one fit to
whatever rate actually happened:
double piHat = (double) x / n;
double logL0 = (n - x) * Math.log(1.0 - p) + x * Math.log(p);
double logL1 = (n - x) * Math.log(1.0 - piHat) + x * Math.log(piHat);
return -2.0 * (logL0 - logL1);
The statistic is chi-square with one degree of freedom — one parameter
(piHat vs. the fixed p) is being tested — and chiSquareSurvival1
turns it into the p-value the picture reports. On Module 9.1's calibrated
delta-normal forecast, backtested against a fresh 2,000-day sample: 22
exceptions against 20.0 expected, Kupiec p-value 0.658 — nowhere near
enough of a gap to reject.
Christoffersen: did they cluster?
A model can get the count exactly right and still be a bad model, if every exception happened during the same two-week meltdown instead of being spread through the year — that's a sign the model wasn't reacting to changing volatility. Christoffersen's independence test checks exactly that, by counting how often an exception day is followed by another exception day:
double logLPooled = xlogy(n01 + n11, pi) + xlogy(n00 + n10, 1.0 - pi);
double logLSplit = xlogy(n01, pi0) + xlogy(n00, 1.0 - pi0)
    + xlogy(n11, pi1) + xlogy(n10, 1.0 - pi1);
return Math.max(0.0, -2.0 * (logLPooled - logLSplit));
n01/n11 count transitions into an exception day from a calm day or
another exception day; pi0/pi1 are the exception rate conditional on
yesterday's state. If exceptions are independent of each other, those two
conditional rates should match the pooled rate pi — logLPooled and
logLSplit should be close, and the statistic (again chi-square with one
degree of freedom) should be small. On the same 2,000-day run: Christoffersen
p-value 0.241 — also not rejected.
Wrote and ran a standalone probe (javac+java against the built classes,
same approach as every prior module) to see how sharp the split between
these two tests really is: took exactly 20 exceptions out of 2,000 days
— precisely the expected count under a 99% forecast, so Kupiec's piHat
equals p exactly and its p-value comes back 1.0000 — and placed them
two ways. Packed into one contiguous 20-day block, Christoffersen's
p-value is 0.0000 (rejected). Spread one every 100 days instead, same
forecast, same count: Christoffersen's p-value is 0.5355 (accepted).
Kupiec is completely blind to when the exceptions happen, by
construction — it only ever sees the count x. Christoffersen is the only
one of the two that can catch a model whose volatility forecast lagged a
real regime change, even when the yearly tally looks perfectly calibrated.
Combining them: conditional coverage
Neither test alone is the actual accept/reject call a risk desk uses.
VarBacktest.of sums the two statistics and reads the combined result off
a chi-square with two degrees of freedom — one for the rate, one for the
independence — again via a closed-form survival function:
double cc = kupiec + ind;
double ccP = chiSquareSurvival2(cc);
private static double chiSquareSurvival2(double s) {
  return s <= 0.0 ? 1.0 : Math.exp(-0.5 * s);
}
rejectedAt(0.05) just compares that p-value to a chosen significance. On
Module 9.1's calibrated forecast: conditional coverage p-value 0.456 —
accept. The model's 22-of-2,000 exception record, spread through
the year the way Christoffersen expects, is exactly what a correctly
calibrated 99% VaR forecast should produce.
Try it yourself
Shrink the calibrated forecast by 20% — one line, 0.8 * dn1 instead of
dn1 — and rerun the backtest on the same realised series. The exception
count jumps from 22 to 76 against an expectation of 20.0; Kupiec's
p-value collapses to 0.0000, and conditional coverage rejects outright.
An under-forecast VaR doesn't just fail quietly — the same test that
accepted the real number rejects a 20%-too-tight one this hard, on the
exact same 2,000 days.
▶️ Run it
mvn -o -q -pl nablatensor-examples exec:java \
  -Dexec.mainClass=com.nablatensor.examples.VarEsShowcase -Dwindow=4000
The backtest is the last block VarEsShowcase prints, using the same
delta-normal forecast Module 9.1 already walked through — no new command,
just the part of the existing output this page finally explains.
⚠️ What this doesn't do
The realised P&L this page backtests against is resampled from the same
quadratic model being tested, not an independent year of real market
history — a genuine test needs the forecast's rate to hold up against
P&L nobody built to match it. And VarBacktest implements the academic
Kupiec/Christoffersen pair, not a regulatory traffic-light scheme: Basel's
actual backtesting framework counts exceptions over a rolling 250-day
window and reads off fixed green/yellow/red capital-multiplier zones, a
different (and simpler) test than a p-value threshold, and this engine
doesn't implement that zoning at all.
What's next
→ Deeper: Value at Risk and Expected Shortfall
covers the same VarBacktest class alongside the three VaR routes it
checks, plus the pinned test tolerances this page's numbers are checked
against.
→ Next: The scenario DSL — Module 9.3 asks how
a "what if" shock gets described without writing a new kernel for it.