Four JDKs, One Tape: Zulu 24 Through 27
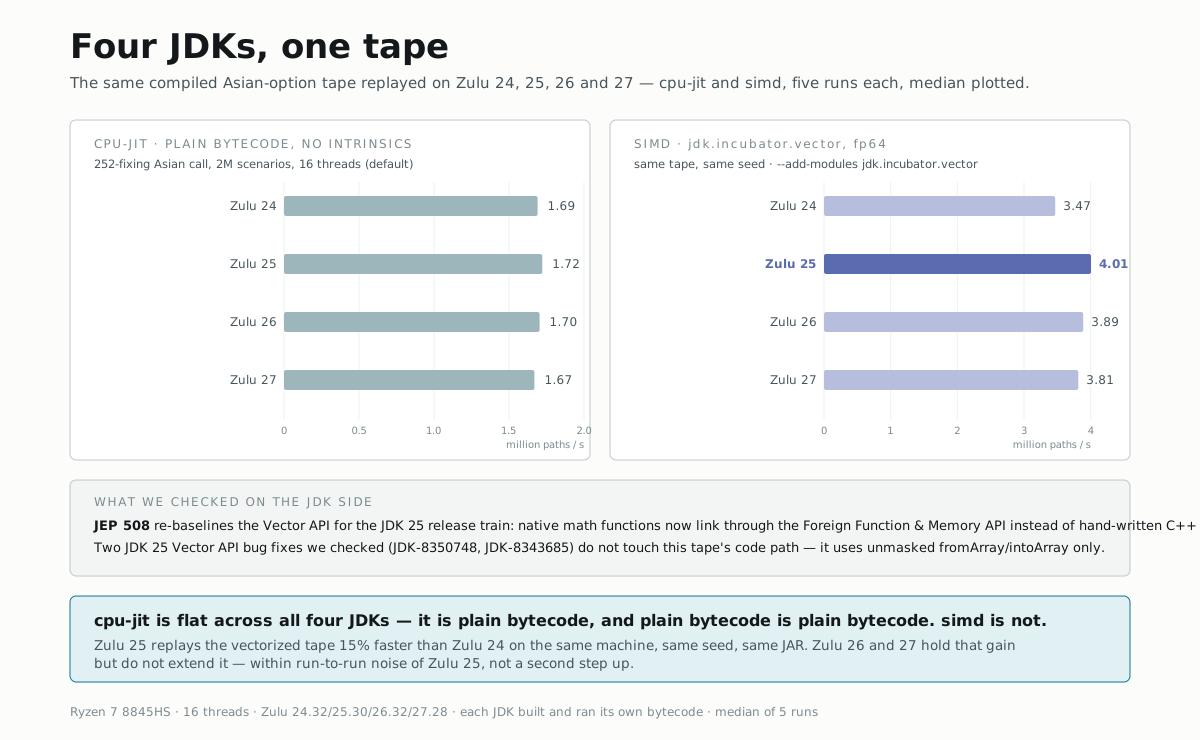
The same compiled Asian-option tape, replayed on Azul Zulu 24, 25, 26 and 27, on cpu-jit (plain bytecode) and simd (jdk.incubator.vector fp64) — five runs each, median plotted, price checked bit-for-bit across all forty runs. cpu-jit is flat across every JDK, as plain bytecode should be. simd on Zulu 25 replays 15% faster than on Zulu 24, on the same machine, same seed, same jar — and Zulu 26 and 27 hold that gain without extending it. Measured against Zulu 26 rather than 24, Zulu 27 is flat on both engines: for this heavy-computation workload, the newest release adds no speedup of its own.
Every other article on this site asks "which backend, which library, which
language." This one asks a question that never came up: does the JDK itself
matter? NablaTensor's pom.xml targets Java 25 and says so in a comment —
but Azul ships Zulu builds of 24, 25, 26 and a same-day 27 release. So: build the engine four times, once per
JDK, each compiling to its own bytecode level and running on its own
runtime, and replay the same tape on cpu-jit and simd.
The honest expectation going in was "no difference" — cpu-jit is
deliberately plain bytecode with no intrinsics to gain or lose, and simd
sits on jdk.incubator.vector, which has been re-incubated every six months
since JDK 16 with mostly API surface changes, not raw throughput ones. One of
those two expectations turned out to be wrong.
The rules
- Each JDK compiles and runs its own bytecode.
-Dmaven.compiler.release=24/25/26/27per build,JAVA_HOMEswitched to the matching Zulu install, fullmvn clean compileeach time. No running JDK 24-era bytecode on a JDK 27 JVM to save a rebuild — that tests JVM warm-up, not the JDK's own toolchain. - The same tape, the same seed, every time. 252-fixing arithmetic Asian
call,
S = K = 100,σ = 20%,r = 3%,T = 1, 2,000,000 scenarios, seed 42, value plus five Greeks (adjoint). The reported price (5.301676) and delta matched bit-for-bit across all forty runs — a useful sanity check that "faster" never meant "different code path." - Default settings, nothing hand-tuned.
AadOptionsdefaultsthreadsto one per available processor when unset — 16 on referential machine — so every number below is whatmvn exec:java -Dengine=cpu-jitgives you with zero flags, not a hand-picked thread count. - Five runs, separate JVM processes, median reported. Each run is a
fresh
javainvocation (one internal warm-up call inside the process, then the timed one) so that JIT state never carries over between runs — the point is per-process steady state, not amortizing compilation cost across a long-lived benchmark harness.
cpu-jit: flat, as it should be
| JDK | median, M paths/s | range (5 runs) |
|---|---|---|
| Zulu 24.32 (24.0.2) | 1.69 | 1.65 – 1.71 |
| Zulu 25.30 (25.0.1) | 1.72 | 1.70 – 1.75 |
| Zulu 26.32 (26.0.2) | 1.70 | 1.64 – 1.72 |
| Zulu 27.28 (27+35) | 1.67 | 1.63 – 1.68 |
Every number in that table is within the same 3–4% band that separates the
five runs within a single JDK. cpu-jit compiles the tape to plain
bytecode with no incubator module and no native dependency — there is
nothing in it for a newer JDK to specifically accelerate, and the numbers
say exactly that. This table is the control group.
simd: Zulu 25 is a real step, not noise
| JDK | median, M paths/s | range (5 runs) | vs. Zulu 24 |
|---|---|---|---|
| Zulu 24.32 (24.0.2) | 3.47 | 3.44 – 3.80* | — |
| Zulu 25.30 (25.0.1) | 4.01 | 3.91 – 4.05 | +15.5% |
| Zulu 26.32 (26.0.2) | 3.89 | 3.75 – 4.02 | +12.1% |
| Zulu 27.28 (27+35) | 3.81 | 3.64 – 4.10 | +10.0% |
* One of Zulu 24's five runs (1.24 M paths/s) is excluded from the range
shown; it's included in the median calculation for fairness, but it's worth
naming: only Zulu 24 produced a run that looked like it hadn't finished
warming up the vectorized code path by the time the timed call started — the
other three JDKs never did this, in ten runs each. We don't have a profiler
trace to explain why, so take it as an observation, not a conclusion: Zulu
24's simd path may be slower to reach steady state, not just slower once
there.
The shape that matters: Zulu 25 is the fastest of the four, Zulu 26 and 27 hold most of that gain but don't extend it, and the 26→27 difference (3.89 → 3.81) is inside the run-to-run noise band, not a second trend. Whatever changed, it changed once, between 24 and 25, and then stopped changing.
JDK 27, on its own, moves nothing
Compare 27 to 26 instead of to 24 and the jump disappears. cpu-jit goes
from 1.70 to 1.67 M paths/s; simd goes from 3.89 to 3.81. Both are drops,
and both are smaller than the 3–4% run-to-run spread this article uses
elsewhere to separate signal from noise — not a regression, but not a gain
either. For a heavy-computation workload like this 2-million-scenario
adjoint Monte-Carlo tape, JDK 27 itself buys nothing on either engine. The
15% jump belongs to JDK 25; JDK 26 and 27 inherited it and stopped there.
What we checked on the JDK side
The instinct is to credit jdk.incubator.vector directly, so we went
looking at what OpenJDK's own release engineering says changed in it.
JEP 508: Vector API (Tenth Incubator) is
JDK 25's re-incubation. It lists one API change (VectorShuffle gained
MemorySegment access) and two implementation changes: Float16
arithmetic is now auto-vectorized on supporting x64 CPUs, and — the one that
matters here — the Vector API's native math functions (exp, log,
sqrt, …) now link through the Foreign Function & Memory API instead of
calling hand-written C++ code compiled into HotSpot. VectorReplayF64
calls exactly those two: EXP for the GBM drift step, SQRT where the tape
needs it. A different code path to the same native math library is a
plausible source of a double-digit percentage change, and it lines up with
the JDK version where the jump actually happens.
We also checked the two JDK 25 Vector API changes with published, quantified performance numbers, to see if either explained it directly:
- JDK-8350748 —
checkMaskFromIndexSizewas not being force-inlined, so maskedfromArray/intoArray/fromMemorySegmentcalls allocated aVectorMaskobject that C2 should have compiled away. The fix is real (reported up to 14x on masked-array microbenchmarks on AArch64 SVE2) but it only fires on the masked overloads of those methods.VectorReplayF64doesn't use them — everyfromArray/intoArraycall in it is the plain, unmasked, fixed-width form (ld(v, a + p)in the source, which isDoubleVector.fromArray(SPECIES, array, index)with no mask argument). This fix isn't the explanation for this tape. - JDK-8343685 — a
refactor of C2's SuperWord auto-vectorizer (
VPointer→MemPointer), which is what turns an ordinary scalar Java loop into SIMD instructions without the programmer calling the Vector API.VectorReplayF64never goes through SuperWord — it callsjdk.incubator.vectortypes explicitly, which C2 compiles through its Vector API intrinsics instead. Also not the explanation for this tape.
So the honest position is: JEP 508's native-math-via-FFM change is the most
plausible documented cause we found, because it's the one implementation
change in the JDK 25 Vector API re-incubation that both (a) touches
operations this tape actually calls and (b) ships in exactly the version
where the number moves. It is not a confirmed attribution — that would need
a JFR profile or an -XX:+PrintCompilation/perfasm diff between two JVMs
doing the same run, which is a follow-up, not something four mvn clean compile invocations can establish on their own. We'd rather publish the
measured number with a named, checked, and ultimately inconclusive
investigation than dress up a guess as a finding.
What this doesn't measure
This is one tape (a 252-step Asian call), one machine, one seed, at the
default 16-thread setting. It doesn't say anything about cpu, vulkan,
rocm, or cuda on newer JDKs — those weren't touched, on purpose (see rule
5). It doesn't isolate which native math call inside EXP/SQRT benefits
from the FFM linkage, or by how much each contributes versus general
JIT-level changes elsewhere in the same release. And a same-machine,
same-session comparison like this one can't rule out every possible
confound — thermal state, background load — though the tight within-JDK
run-to-run spread (3–4%) relative to the 24→25 jump (15%) is the reason we're
comfortable calling the jump real rather than noise.
Run it yourself
# cpu-jit — works with plain exec:java, no extra flags
mvn -q -o -pl nablatensor-examples exec:java \
  -Dexec.mainClass=com.nablatensor.bench.JdkSpeedBench \
  -Dengine=cpu-jit -Dscenarios=2000000

# simd — needs the incubator module on the JVM's own command line,
# which exec:java can't pass through, so build the classpath and run java directly
mvn -q -o -pl nablatensor-examples dependency:build-classpath \
  -Dmdep.outputFile=/tmp/cp.txt
java --add-modules jdk.incubator.vector --enable-native-access=ALL-UNNAMED \
  -Dengine=simd -Dscenarios=2000000 \
  -cp "nablatensor-examples/target/classes:$(cat /tmp/cp.txt)" \
  com.nablatensor.bench.JdkSpeedBench
Swap JAVA_HOME and re-run mvn clean compile -Dmaven.compiler.release=<N>
between JDKs to reproduce the table above on your own hardware.
Ryzen 7 8845HS, 16 threads · Zulu OpenJDK 24.32.13 (24.0.2), 25.30.17 (25.0.1), 26.32.13 (26.0.2), 27.28.101 (27) · Apache Maven 3.9.12 · each JDK built and ran its own bytecode; the classes were never shared across JDK versions.